Improving your task one IELTS writing
This essay is a task one essay from Adeyemi, a student who reached out on Twitter. The question is asking for a description of a bar chart.
The original essay
The original answer looks like this:
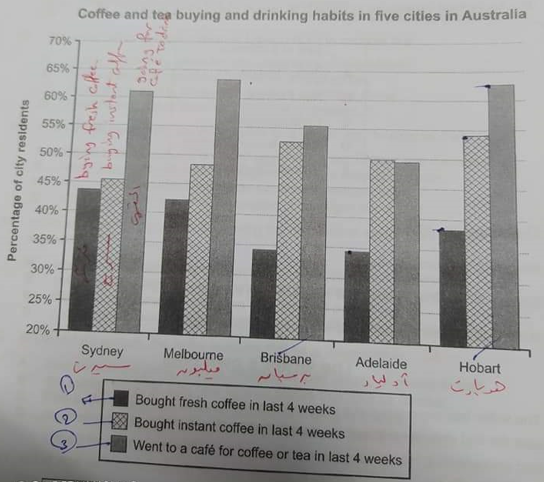
The graph gives information about the way people buy and drink fresh coffee, instant coffee and those who went to café to get coffee or tea in the last four weeks in five Australian cities (Sydney, Melbourne, Brisbane, Adelaide and Hobart). The buying and drinking habits are measured in percentage.
Overall it can be seen that in three major cities Sydney, Melbourne and Hobart have the highest percentage of people who went to café to get coffee or tea in the last month while Brisbane and Adelaide have the lowest in those who brought fresh coffee. In terms of fresh coffee and instant coffee it is noted that Sydney, Melbourne, Brisbane and Hobart have the highest consumption compared with number of those who visted café for coffee and tea.
The consumption of instant coffee in Adelaide is the highest with 50% compared with the other two.
For this essay, I think the most important things to focus on are structural.
Complex vs complicated
The first thing is that some of the sentences are really long. For example, the first sentence is almost thirty words long:
The graph gives information about the way people buy and drink fresh coffee, instant coffee and those who went to café to get coffee or tea in the last four weeks in five Australian cities (Sydney, Melbourne, Brisbane, Adelaide and Hobart).
This feeds into something I talk about a lot: The difference between complex and complicated. If something is complex it means that it is hard to put together; if something is complicated it is hard to understand. An example of this might be a smartphone. It would be impossible for most people to build a smartphone but they are generally quite easy to use. A smartphone, then, is complex but not complicated. Similarly, we should try and make our writing complex without being complicated. To rewrite this long sentence I’ve put:
The graph gives information about the way people buy and drink fresh coffee, instant coffee and those who went to café to get coffee or tea in the last four weeks in five Australian cities (Sydney, Melbourne, Brisbane, Adelaide and Hobart). The buying and drinking habits are measured in percentage.
Moving from general to specific in task one answers
One important thing to keep in mind for IELTS task one writing answers is that a good answer will move from broad to specific. There are so many things we could say about this chart, but that doesn’t mean we should say them. It’s better to talk generally about broad themes and then move onto the specifics at the end.
When looking for broad themes, it’s often a good idea to look at the extremes. On a bar chart, that means looking for the largest and smallest bars. Looking at our bar chart again, we can see for each city, fresh coffee was the least popular activity. In addition, we can see for four out of five cities, going to a cafe was the most popular option. While each essay is different, these are the sorts of broad themes you should look at during task one essays. To reflect this, I’ve written:
For all of these cities, buying fresh coffee was the least popular option out of the three. For every city except Adelaide, going to a café was the most popular activity. However, in Adelaide, the consumption of instant coffee was the highest at 50%. For the other cities, instant coffee was the second most popular option.
Using ‘for’ in task one
A structure that I’ve used in my answer quite extensively is:
For x, y.
In this structure, the x part tells you what group or thing you’re describing and then the y gives the description. For example:
For every city except Adelaide, going to a café was the most popular activity.
Here we can see that the group is ‘every city except Adelaide’ and the description is ‘going to a cafe was the most popular activity. This structure is very useful for task one because we have so many things to describe. Using ‘For x, y.‘ means we can be very precise about what we are describing.
My version
Having made some structural changes to the essay and using ‘for’ to make the writing more precise, the essay looks like this:
This chart looks at coffee and tea consumption habits in five Australian cities: Sydney, Melbourne, Brisbane, Adelaide and Hobart. It gives information about the percentage of people who bought fresh coffee, instant coffee and who went to a café for coffee or tea in the last month.
For all of these cities, buying fresh coffee was the least popular option out of the three. For every city except Adelaide, going to a café was the most popular activity. However, in Adelaide, the consumption of instant coffee was the highest at 50%. For the other cities, instant coffee was the second most popular option.
Among all the cities, Melbourne had the highest percentage of café-goers with over 60% of people having been to a café in the last four weeks. Meanwhile, Adelaide had the fewest café-goers with fewer than 50% of people having been to a café in the last month. Instant coffee was most popular in Hobart with almost 55% of people having bought it in the last four weeks, while this number was lowest in Sydney at just over 45%. Finally, Sydney had the greatest proportion of fresh coffee buyers with almost 45% of people buying fresh coffee there. This proportion was lowest in Brisbane at less than 35%.


