Band nine model answer
The pie charts below show the online sales for retail sectors in New Zealand in 2003 and 2013.
Summarise the information by selecting and reporting the main features, and make comparisons where relevant.
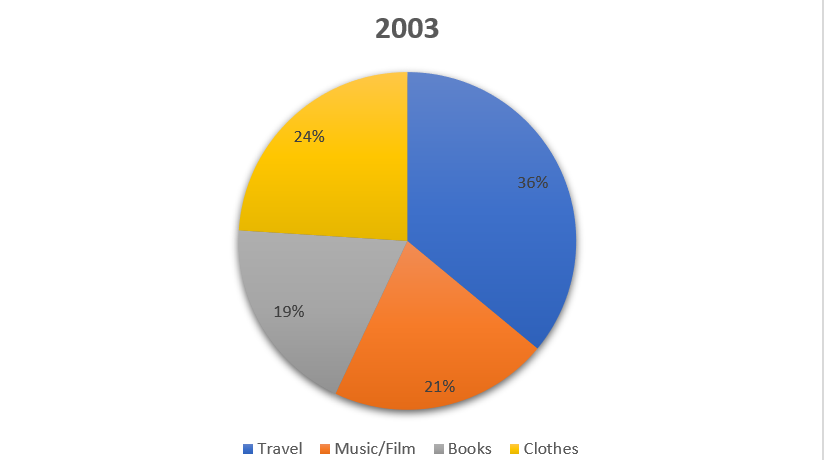
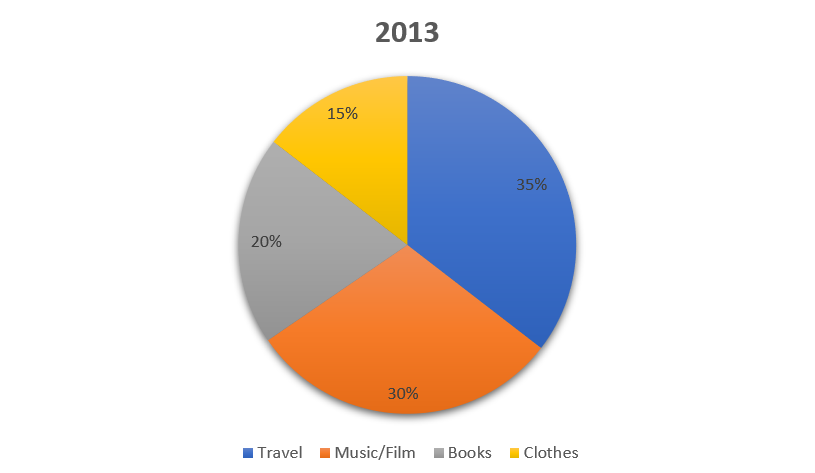
These two pie charts show the amount of online sales in four areas: books, travel, music and film and clothing in 2003 and 2013. Overall, while the music and film and clothes sectors saw significant shifts over this decade, books and travel remained relatively stable. Although travel saw the most sales in 2003, media sales had overtaken it by 2013. Clothing became comparatively less popular over this period, falling behind books to become the least popular sector.
To begin, in 2003, Travel was the largest sector making up just over a third of sales. Conversely, books were the least popular with just under a fifth of total sales. Meanwhile, music and film and clothes each made up just over a fifth of total sales.
In 2013, although travel fell slightly in popularity, it remained as the sector with most purchases. The proportion of sales taken up by books was also relatively stable at two-fifths. While clothes fell in popularity from just under a quarter to just under a sixth, music and film grew to approximately three-tenths.
Why is this essay band nine?
Structure
If you’re answering a pie chart task one essay, you may be confused about what to include in the outline. The most important things to pay attention to are the biggest and smallest numbers and any significant changes. It’s usually possible, like I have, to write a fairly substantial outline for a pie chart task one answer.
Pie chart vocabulary
When you are describing a pie chart, it is easy to end up with a list of numbers without much complex grammar. One way to solve this problem is to use fractions rather than percentages. This means that you should use phrases like ‘just over a third’ rather than ‘35%’. To construct these, you first need to figure out what the nearest fraction is. You use this table to give yourself an idea:
| 80% | four-fifths |
| 75% | three-quarters |
| 70% | seven-tenths |
| 66.6% | three-thirds |
| 60% | three-fifths |
| 50% | half |
| 40% | two-fifths |
| 33.3% | one-third |
| 25% | one-quarter |
| 20% | one-fifth |
| 10% | one-tenth |
Once you’ve found the nearest fraction, it’s unlikely to be exactly the number you are looking for. There are a few phrases you can use to get around this problem.
- Approximately one-third
- Just over one-third
- Just under one-third
In this way, you can describe most numbers in a more interesting and grammatically complex way.

