Band nine sample essay
This chart shows music sales in the United Kingdom by medium. Summarise the information by selecting and reporting the main features, and make comparisons where relevant.
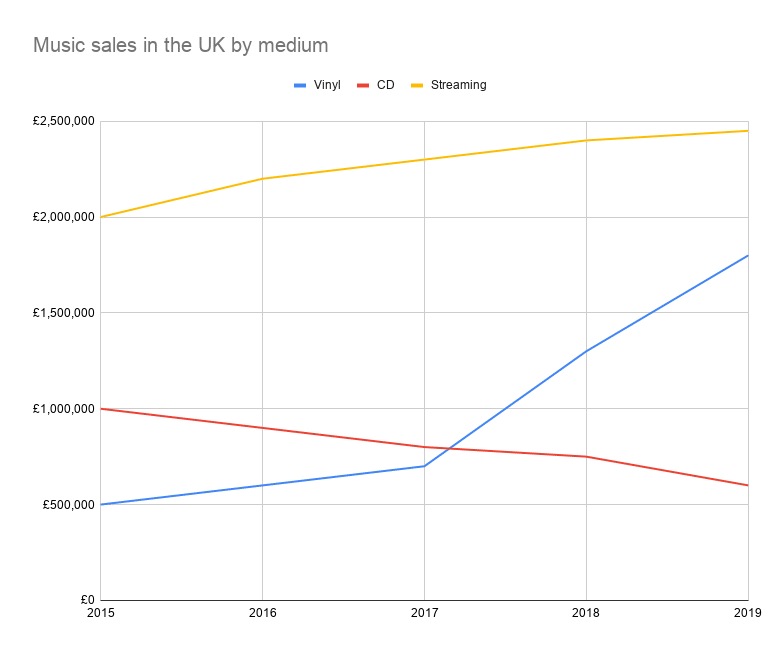
This chart gives the sales revenue for three types of music, LPs, CDs and online streaming in the UK from 2015 to 2019. Streaming services began as the most popular option and grew in popularity steadily over that time. Vinyl began as the least popular option, but saw a rapid growth from 2017 that saw them overtake CDs, which declined slowly through the period.
For streaming services, such as spotify, their sales revenue grew gradually from two million pounds to two and a half million pounds. Conversely, compact disks became less popular over time, falling from one million pounds in sales to just over half a million pounds. This led them to become the least popular option by 2019.
Although the sale of vinyl records initially grew slowly, there was an inflection point in 2017. After this, the growth skyrocketed. The sale of vinyl records overtook CDs just after this and ended at around 1.8 million pounds. The sale of vinyl approached, but did not overtake, the sales from streaming services in this time.

